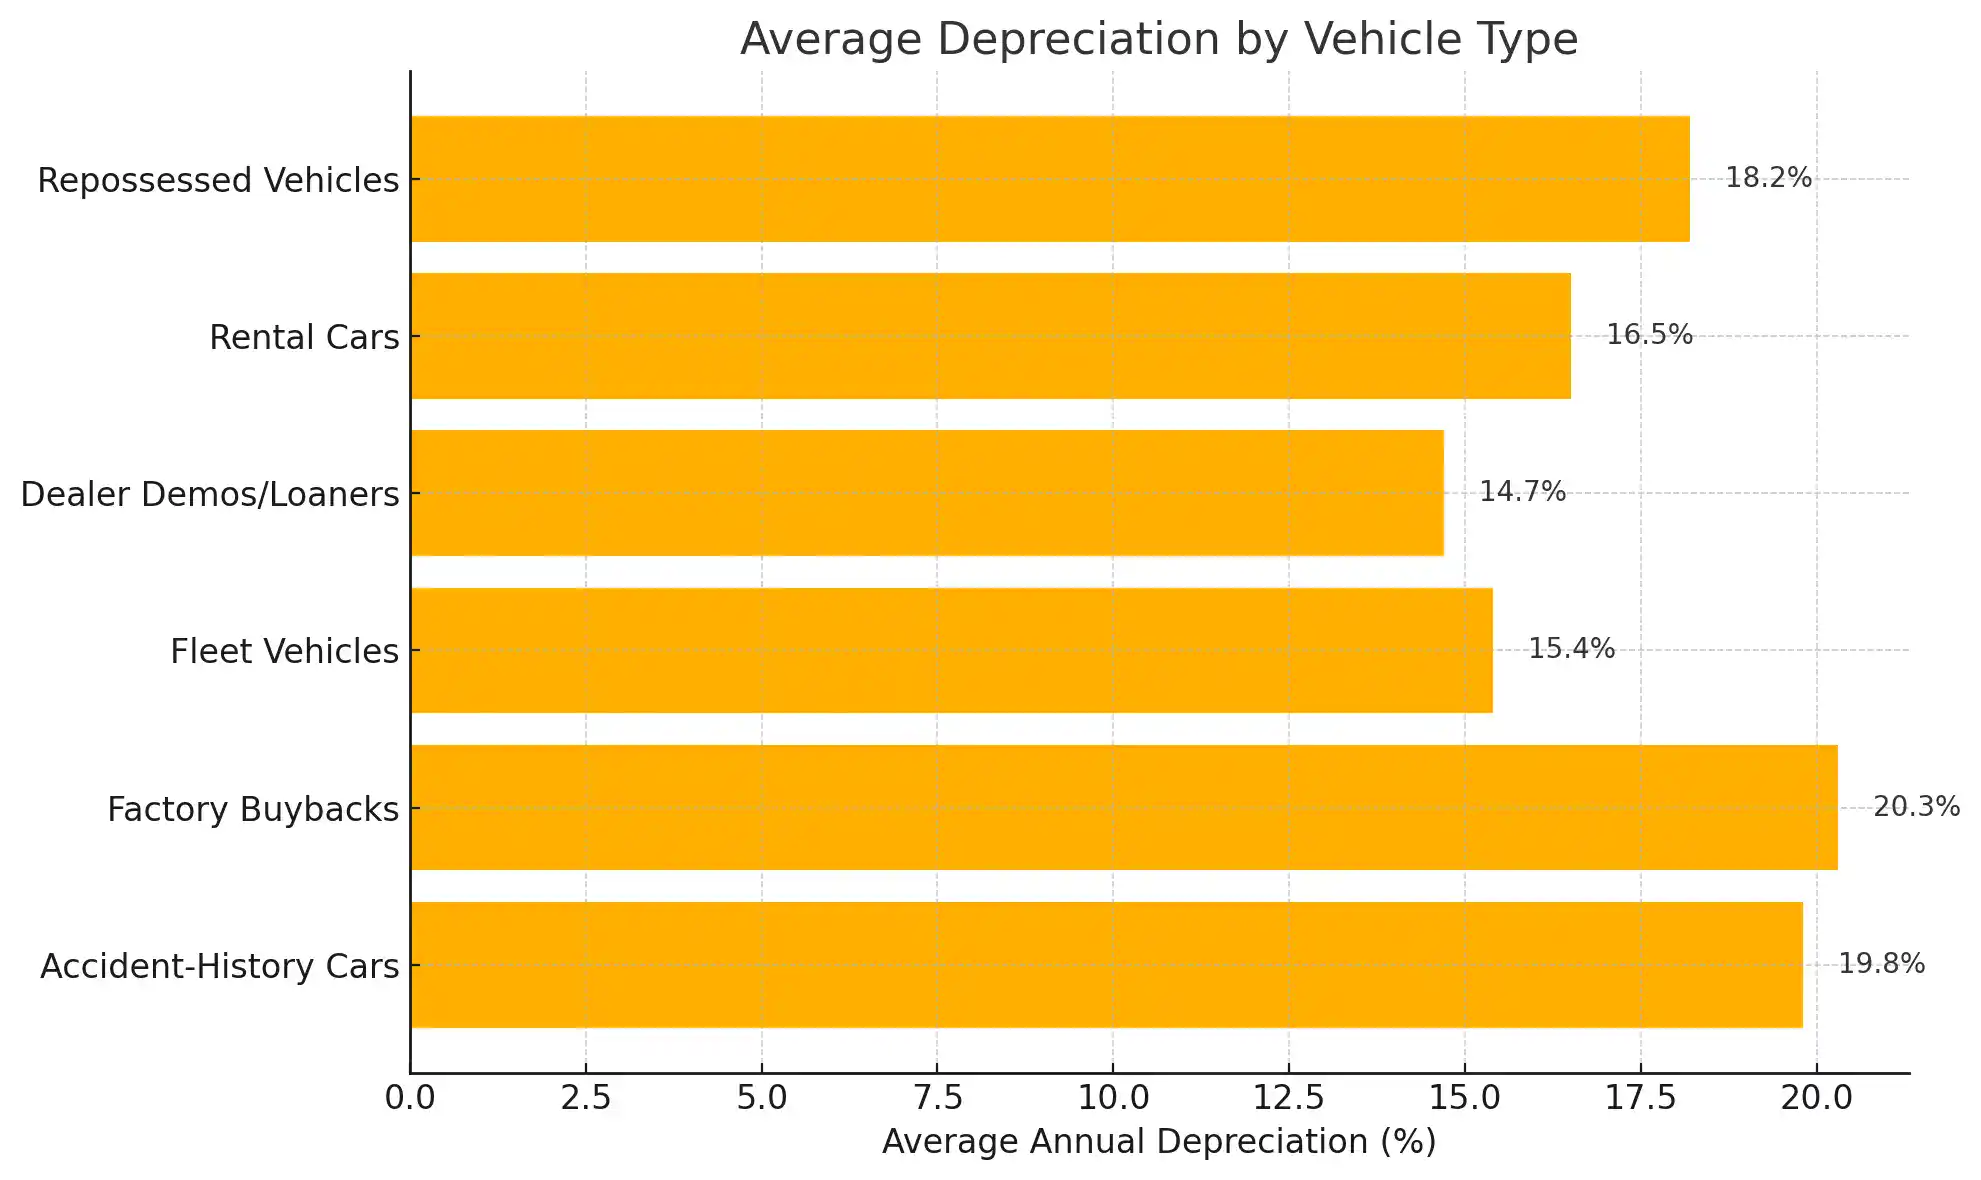
The bar chart presents average annual depreciation for six categories of used cars: factory buybacks (20.3%), accident-history cars (19.8%), repossessed vehicles (18.2%), rental cars (16.5%), fleet vehicles (15.4%), and dealer demos/loaners (14.7%). These figures signal high-risk vehicles for 2025 buyers concerned about resale value, diminished value claims, and total loss vulnerability.